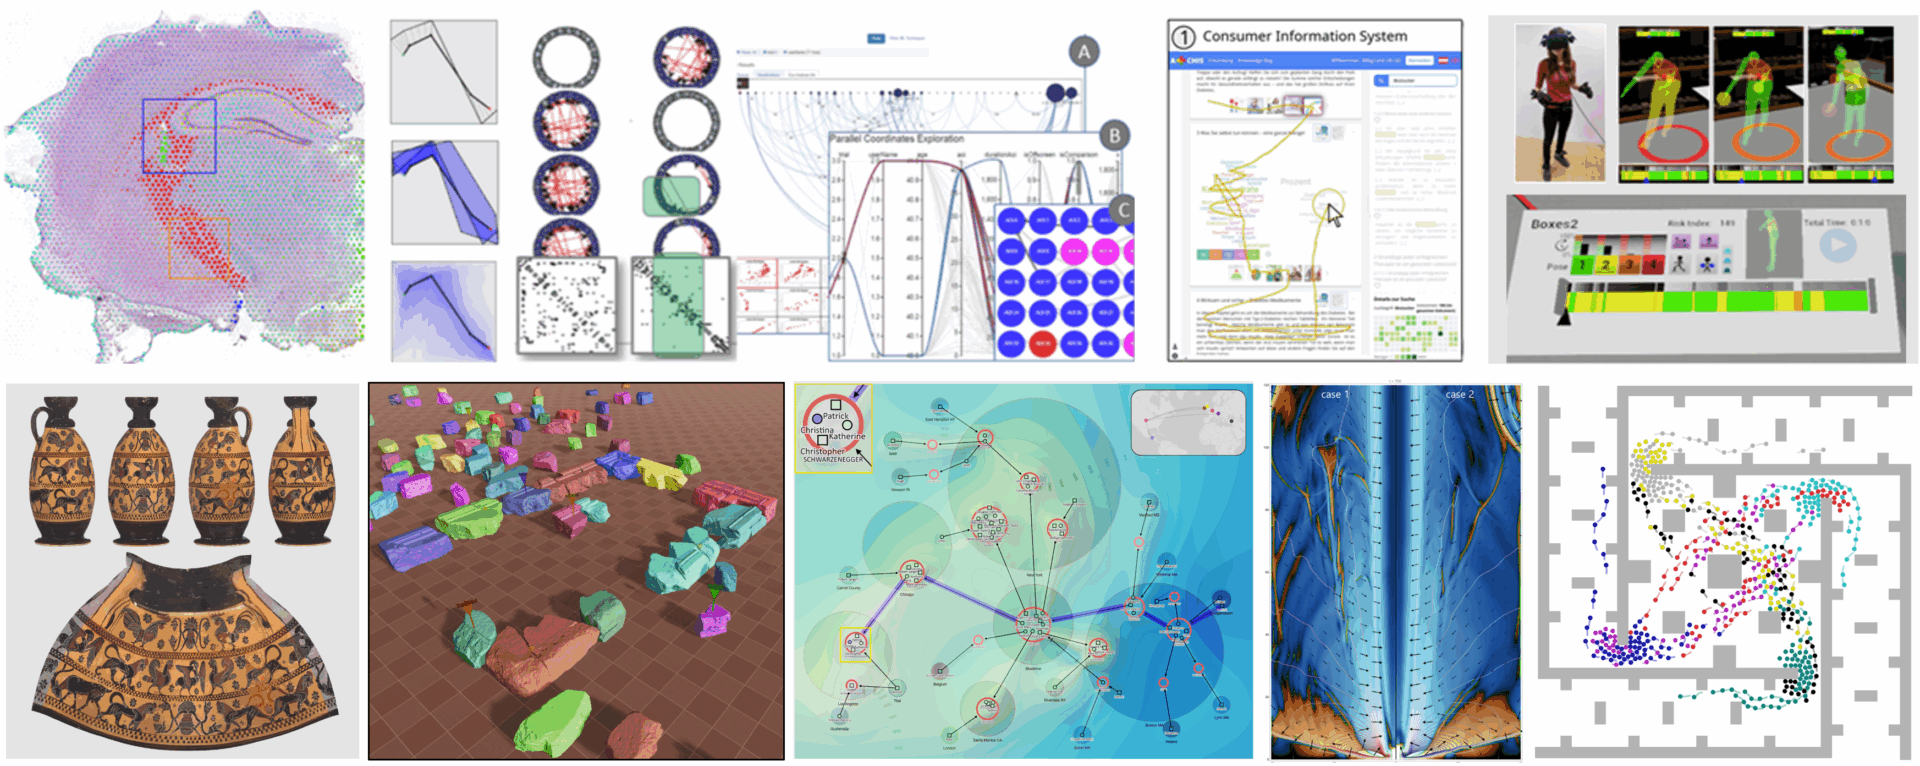
The Visual Analytics Group, led by Tobias Schreck, researches methods for interactive visual exploration and analysis of large and complex data sets. We integrate data visualization, data analysis, and user interaction to help stakeholders to create actionable knowledge from data. Our approaches help to discover patterns and rules in data, find anomalies, understand events, dependencies and influencing factors, and generally to understand and make sense of data. The group has research experience in visual analysis of many different types of data, e.g., time series, spatial, network, multivariate and 3D data. Hence we support many important fields of applications with visual data analysis, in which we apply and evaluate our approaches. Recent funded projects are in data analysis of biomedical, industrial, engineering, and cultural heritage data. Our methods leverage desktop as well as large-scale and immersive display environments.


